
아날로그와 디지털사이
Bike Sharing Demand EDA(Kaggle) 본문
0. Data Field
datetime - hourly date + timestamp
season - 1 = spring, 2 = summer, 3 = fall, 4 = winter
holiday - whether the day is considered a holiday
workingday - whether the day is neither a weekend nor holiday
weather
1: Clear, Few clouds, Partly cloudy, Partly cloudy
2: Mist + Cloudy, Mist + Broken clouds, Mist + Few clouds, Mist
3: Light Snow, Light Rain + Thunderstorm + Scattered clouds, Light Rain + Scattered clouds
4: Heavy Rain + Ice Pallets + Thunderstorm + Mist, Snow + Fog
temp - temperature in Celsius
atemp - "feels like" temperature in Celsius
humidity - relative humidity
windspeed - wind speed
casual - number of non-registered user rentals initiated
registered - number of registered user rentals initiated
count - number of total rentals
1.Boxplot - 데이터 확인
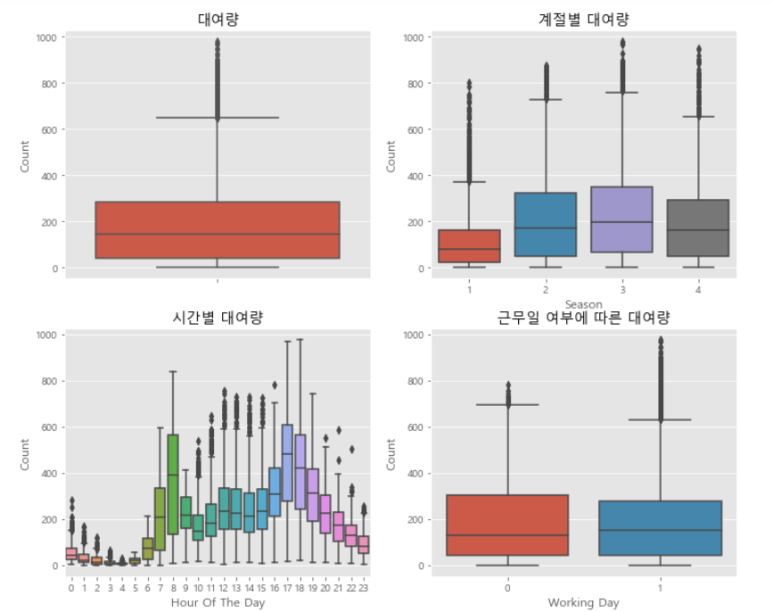
대여량은 특정구간에 몰려있음
계절 : 4월과 9월 사이가 대여량이 많다
출퇴근 시간대가 대여량이 많다.
큰차이는 없지만 근무하지 않는날이 좀더 대여량이 많다.
2. pointplot - 시계열 데이터 확인
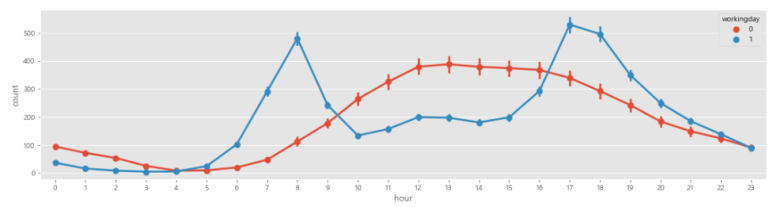
0 - 주말, 1 - 평일
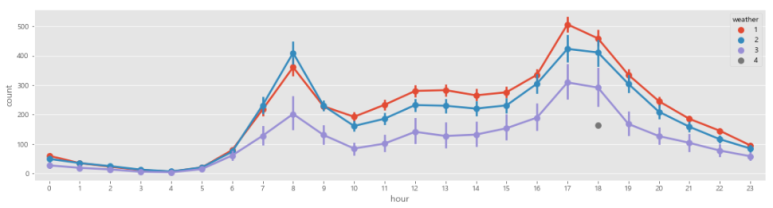
1~4 : 흐린정도(1=맑음, 4=비)
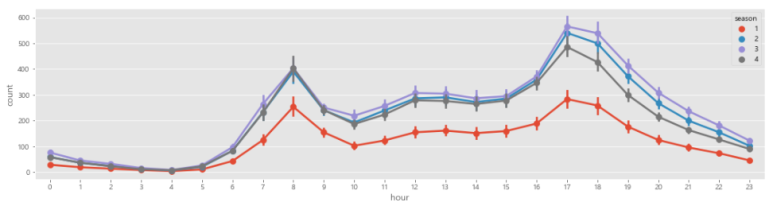
1-겨울, 2-봄, 3-여름, 4-가을(미국 기준 계절)
3. regplot - 날씨 특성 데이터 확인
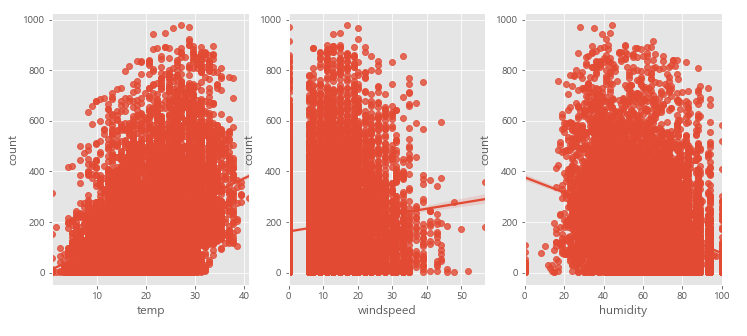
온도, 풍속, 습도와 대여랑
4. barplot - 년도, 월별 대여량 확인
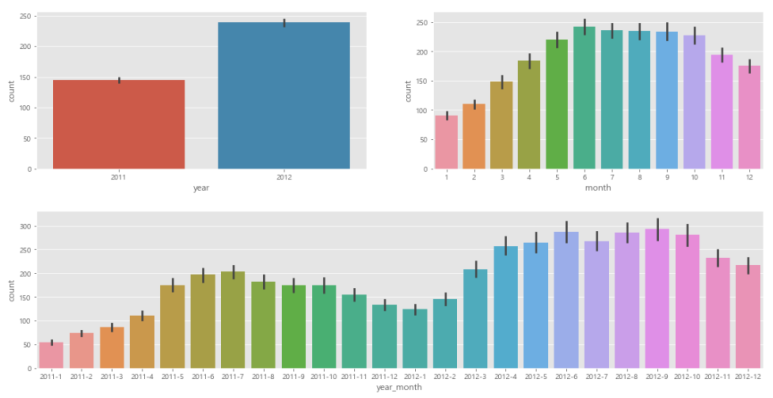
년도, 월별 대여량
'DA' 카테고리의 다른 글
| 데이터리안_Week1_리텐션 (0) | 2024.01.14 |
|---|---|
| Funnel analysis (0) | 2022.08.21 |
| Titanic_Feature Engineering & Data Cleansing(Kaggle) (0) | 2022.01.28 |
| Titanic_EDA(Kaggle) (0) | 2022.01.28 |


